Setup
Flow direction: Bidirectional
Boundary condition: Open
Places of research: Sidewalks at the University of Missouri and Stephens College (field studies)
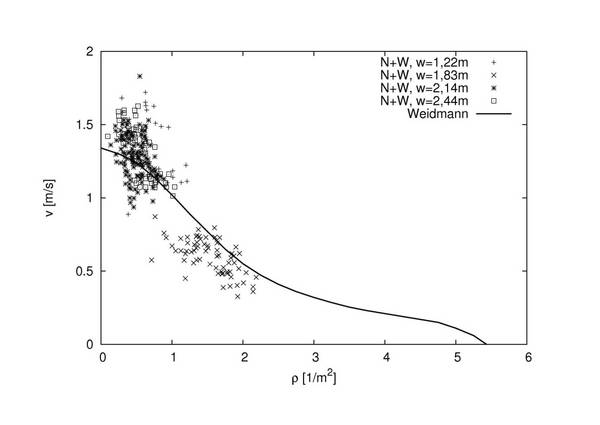
Widths of sidewalks:
- w = 1,83 m (Stephens College)
- w = 1,22 m (University of Missouri)
- w = 2,14 m (University of Missouri)
- w = 2,44 m (University of Missouri)
Subjects:
- Young adults (approx. 18 - 25 years)
- Solely females at Stephens College
- Mixed at University of Missouri
Data collection:
- Time lapse (four frames per second) color photographs of the test sections were taken from an elevated position.
- Control points at the edges of the walk and a grid were placed on the section, photographed and removed, except the control points, during observation.
- The grid was projected on a screen, control points and coordinates marked and the grid lines were drawn. The control points were used to reposition the projected image as data translation proceeded.
- The approximate center line of the individual was located on the grid and the position recorded in cartesian coordinates.
- Each fourth frames (one second in elapsed time) was used as a data source with pedestrians identified by test section, flow direction, number, sex and x-y location.
- The data of time and location were used to calculate the average speed of every single pedestrian and the concentration of pedestrians in each observation.
Fundamental Diagram
Data
The data can be found in a zip-file.
References
F.P.D. Navin and R. J. Wheeler
Pedestrian Flow Characteristics
Traffic Engineering 39, pp. 30-36, 1969